Analyzing and visualizing software development
vizGrimoire (usually pronounced /ˌvɪzɡrɪmˈwɑr/) is a toolset and framework to analyze and visualize data about software development. Currently, it is focused on data produced by the MetricsGrimoire tools (CVSAnalY, Bicho and MailingListStats).
vizGrimoire is promoted by Bitergia, the company providing software develoment analytics services, but it is a project open to the community: you are welcome to participate.
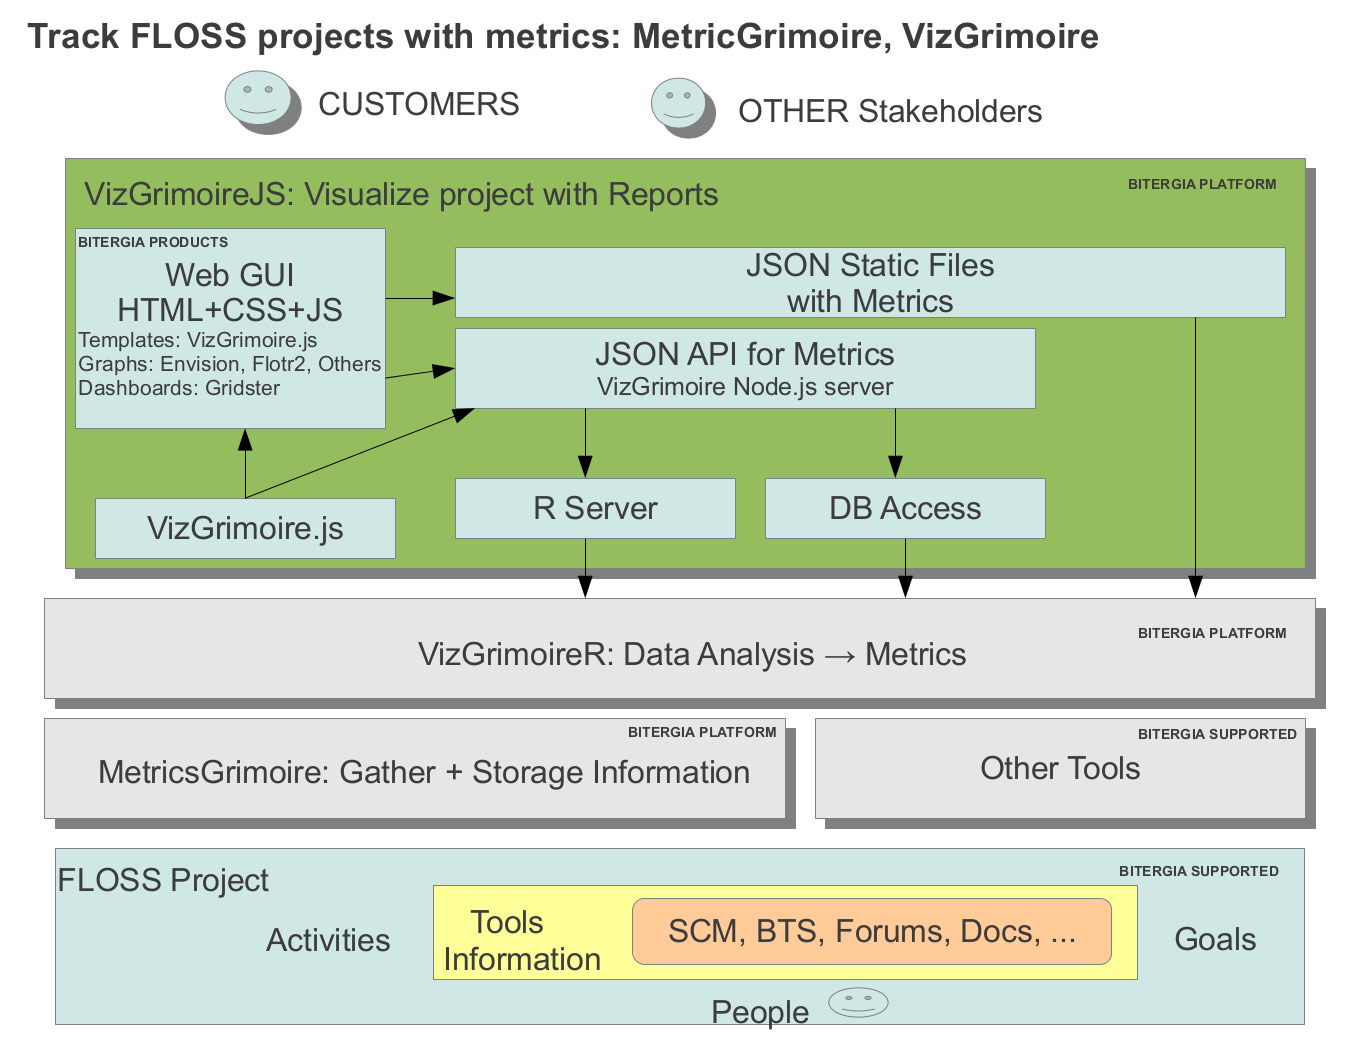
The following is a list of the current set of tools with a brief description. For more information, visit each of tool repositories, and/or read their install and readme files. You can also have a glimpse of the intended vizGrimoire architecture.
Analyze data in databases produced by MetricsGrimoire tools from software development repositories (source code management systens, issue tracking systems, mailing lists, etc.).
JavaScript framework to create dashboards and interactive reports and visualizations from data produced by vizGrimoireJS
There are several resources that can be of use for getting the source code, contributing, reporting bugs, or just communicating with developers: